ETCALC - Evapotranspiration online calculator
CONTENTS
- 1. About ETCalc
- 2. Background
- 3. Methodology
- 3.1. Definitions
- 3.2. Crop Coeficients (K)
- 3.3. Penman-Monteith Method (PM)
- 3.4. Thornthwaite Method (TH)
- 3.5. Blaney-Criddle Method (BC)
- 3.6. Turc Method (TU)
- 3.7. Priestley-Taylor Method (PT)
- 3.8. Hargreaves Method (HA)
- 3.9. Jensen-Haise Method (JH)
- 3.10. Abtew Method (AB)
- 3.11. Input and Validation Data
- 4. User Guide
- 4.1. Quick Start
- 4.2. Load Input Data
- 4.3. Perform Evapotranspiration Calculations
- 4.4. Investigate Results and Export Data
- 5. Limitations
- 6. Terms of Use
- 7. References
- 8. Contact
1. About ETCalc
ETCalc is an online evapotranspiration calculator developed through a collaborative research effort
between Canadian Rivers Institute (CRI), University of New Brunswick (UNB), Agriculture and Agri-Food
Canada (AAFC) and Environment and Climate Change Canada (ECCC). ETCalc has been developed as part of
the research effort aimed at evaluating the effects of agricultural production practices on groundwater
and surface water quality and on the quality of downgradient aquatic ecosystems. ETCalc is part of
the Hydrology Tool Set (HTS; https://www.hydrotools.tech),
a suite of tools that can be used for advancing the understanding of various local and watershed scale
hydrological processes. HTS also includes SepHydro (daily baseflow / hydrograph separation; 11 methods), SWIB
(daily estimation of soil water stress, crop water deficit, irrigation requirement and its impact on aquifer
storage, water budget components), SNOSWAB (daily estimation of water balance terms, including snowfall,
snowmelt, snowpack, soil water content, evapotranspiration, drainage, infiltration, surface runoff), GWRech
(daily estimation of groundwater recharge and groundwater discharge), TotPrePart (partitioning of daily total
precipitation into snowfall and rainfall) and FLEX-WQI (estimation of water quality state via water quality
indexes).
ETCalc offers several customizable methods for calculating daily Potential Evapotranspiration (PET) / Reference
Evapotranspiration (ETR) and Actual Evapotranspiration (ET) based on user provided
meteorological data and crop coefficients. The empirical equations included in ETCalc have been already
published
and have been selected following extensive literature research. The web-based tool provides various output and
data
visualization options through a user-friendly interface and a streamlined process.
ETCalc can be used for any location for which the required meteorological data are
available and can employed in studies focused on local or watershed scale water balances,
plant water stress and irrigation requirements, subsurface water storage and impacts of
climate change on water balance components. ETCalc can be used for educational purposes
for example to demonstrate the significance of various evapotranspiration forms or assess
the differences between the various calculation methods. Moreover, ETCalc can also be used
for producing evapotranspiration timeseries input for complex models that might integrate
only a limited number of methods.
For detailed instructions on how to use this tool please refer to the User Guide
section.
If you used ETCalc, please include the following citation(s) in your publication(s):
Danielescu S (2022) Development and Application of ETCalc, a Unique Online Tool for Estimation of
Daily Evapotranspiration. Atmosphere-Ocean, 1-13. DOI : https://doi.org/10.1080/07055900.2022.2154191.
Danielescu S (2021) ETCalc - a web-based tool for estimation of evapotranspiration. Reference Manual. Available at https://etcalc.hydrotools.tech/.
Danielescu S (2021) ETCalc - a web-based tool for estimation of evapotranspiration. Reference Manual. Available at https://etcalc.hydrotools.tech/.
2. Background
Although several definitions exist, evapotranspiration can be simply conceptualised as the sum of evaporation
of water from soil or surface of the ground and the transpiration of plants. Evapotranspiration is a key
component of the hydrological cycle from local to global scales. Therefore, knowledge of the amount of
evapotranspiration is important for example for understanding or estimating local or watershed scale water
balances, plant / crop water stress and irrigation requirements, subsurface water storage, impacts of climate
change on water balance components, etc.
There are currently many equations available for calculating the various forms of evapotranspiration. ETCalc
integrates several of these methods into a streamlined interface that allows for the calculation of daily
Potential
Evapotranspiration (PET) / Reference Evapotranspiration (ETR) and Actual Evapotranspiration (ET) (see table
below). Of note, ETCalc will calculate the various evapotranspiration forms only for the methods for which
data is included in the user input dataset (i.e. the methods for which required input data is not present in
the input file are disabled).
| Method | PP | Tmean | Tmax | Tmin | RHmean | RHmax | RHmin | SRTOA | SRSFC | WND |
|---|---|---|---|---|---|---|---|---|---|---|
| Penman-Monteith (PM) | n.a. | ✓ | Opt. | Opt. | Opt. | Opt. | Opt. | n.a. | ✓ | ✓ |
| Thornthwaite (TH) | n.a. | ✓ | n.a. | n.a. | n.a. | n.a. | n.a. | n.a. | n.a. | n.a. |
| Blaney - Criddle (BC) | n.a. | ✓ | n.a. | n.a. | n.a. | n.a. | n.a. | n.a. | n.a. | n.a. |
| Turc (TU) | n.a. | ✓ | n.a. | n.a. | ✓ | n.a. | n.a. | n.a. | ✓ | n.a. |
| Priestley - Taylor (PT) | n.a. | ✓ | n.a. | n.a. | n.a. | n.a. | n.a. | n.a. | ✓ | n.a. |
| Hargreaves (HA) | n.a. | ✓ | ✓ | ✓ | n.a. | n.a. | n.a. | ✓ | n.a. | n.a. |
| Jensen - Haise (JH) | n.a. | ✓ | n.a. | n.a. | n.a. | n.a. | n.a. | ✓ | n.a. | n.a. |
| Abtew (AB) | n.a. | n.a. | n.a. | n.a. | n.a. | n.a. | n.a. | n.a. | ✓ | n.a. |
*Notations: ✓ - required data; n.a. - not applicable; Opt. - optional data [user units]; PP - daily total precipitation [mm/d]
(Note: PP is not currently used by any of the ETCalc methods; PP could be included in the user input data if
comparison with ETCalc output is of interest); Tmean - daily mean air temperature [°C]
Tmax - daily maximum air temperature [°C]; Tmin - daily minimum air temperature [°C]; RHmean - daily mean air relative [%]
humidity; RHmax - daily maximum air relative humidity [%]; RHmin - daily minimum air relative humidity [%]; SRTOA -
daily solar radiation @ top-of-atmosphere [MJ/m2/d].; SRSFC - daily solar radiation @ surface of the ground [MJ/m2/d];
WND - daily wind speed [m/s].
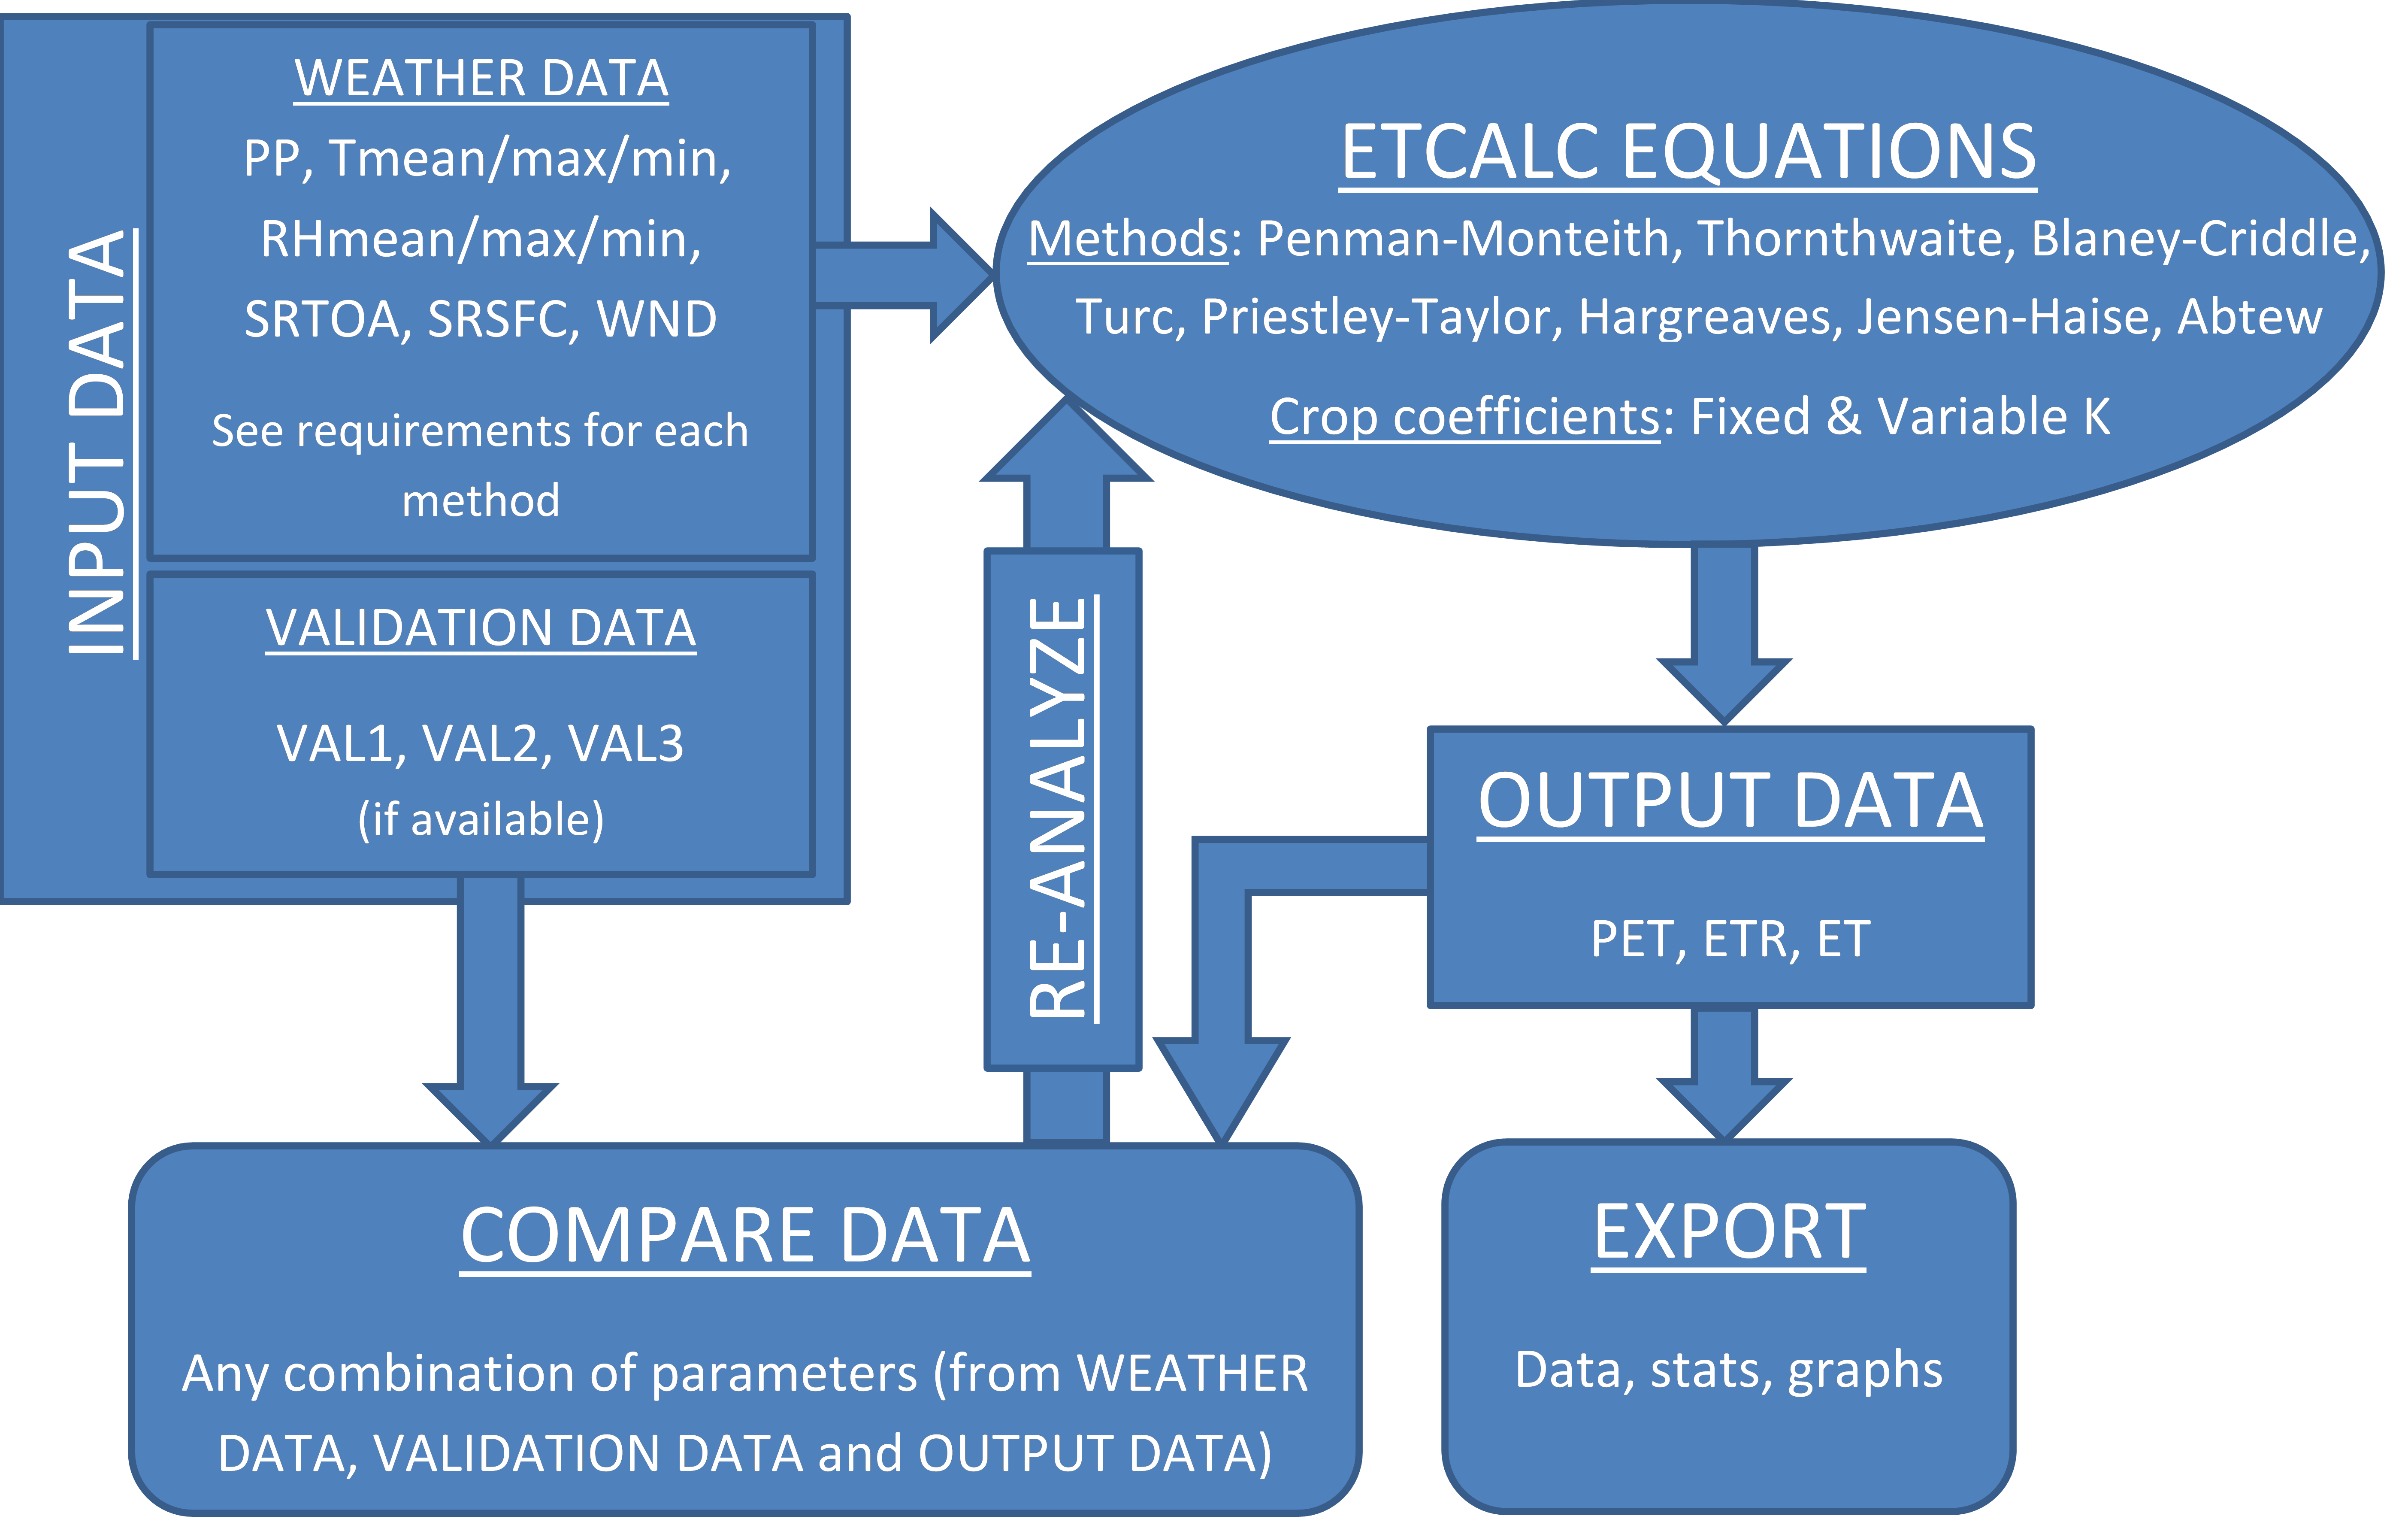
A diagram of ETCalc workflow is shown below. All methods integrated in ETCalc require daily weather data and
depending on
the method, the direct output consists in either Potential Evapotranspiration (PET) or Reference
Evapotranspiration (ETR).
Actual or crop evapotranspiration (ET) is obtained by multiplying the direct output of the method with the
chosen crop
coefficients, which can be fixed throughout the year or variable on a monthly basis.
Figure 1. ETCALC: workflow diagram highlighting input data, validation data, methods available, visualization and export options
For detailed instructions on how to use the evapotranspiration online calculator please refer to the User Guide
section.
3. Methodology
Currently, the ETCalc online evapotranspiration calculator includes 8 methods for calculating the various
evapotranspiration forms. Brief descriptions of the concepts and methods used are included below.
3.1. Definitions
The definitions for the most relevant terms used by the ETCalc online evapotranspiration calculator are included
below. It should be noted, that in literature, there are slight variations in the definition of some of these
terms, and hence, the user is encouraged to thoroughly review the various concepts and definitions used in
calculation of the various forms of evapotranspiration.
Crop coefficients: these are coefficients that allow for accounting for the difference between
potential evapotranspiration (PET) or reference evapotranspiration (ETR) and crop or actual evapotranspiration (ET).
The crop coefficient has been introduced for accounting for the differences between the evapotranspiration for the
actual crop (or “land cover”) and the evapotranspiration for the reference surface or reference crop (i.e. the land
cover or the crop used for calculating PET or ETR). Of note, the definition (and values) of crop coefficients vary
in accordance with the specifics of each evapotranspiration calculation method (i.e. the crop coefficient is method
specific). In ETCalc, the crop coefficients are denoted with the letter K and can be fixed (Kfix, one
value for the entire year) or variable (Kvar, the value can change on a monthly basis).
PET (Potential evapotranspiration): this is considered to be equivalent to the maximum
evapotranspiration that would occur if the water supply is not limiting. Note that specific
evapotranspiration methods might use a slightly different definition for PET. For example, PET could be
considered to be equivalent of the evaporation from an open water surface (e.g. lake). In ETCalc output,
ET0 notation is used for PET, and the user has to refer to the description of the method to identify
if for a particular method either PET or ETR is calculated.
ETR (Reference evapotranspiration): this is typically considered to occur for example
when a short crop (i.e. grass) fully covers the ground and always has a good supply of water. Note that
specific evapotranspiration methods might use a slightly different definition for ETR. ETR is always lower
than PET. In ETCalc output, ET0 notation is used for PET, and the user has to refer to the description of
the method to identify if for a particular method either PET or ETR is calculated.
ET (Crop evapotranspiration or Actual evapotranspiration): this form of evapotranspiration
accounts for both weather (i.e. integrated in PET and ETR formulas) and land cover or crop (i.e. via crop
coefficients). ET is the product of ET0 (PET or ETR, depending of the method) and K (crop coefficient). Note
that specific evapotranspiration methods might use a slightly different definition for the various evapotranspiration
forms or crop coefficients. ET is always lower than PET; however, it can be higher or lower than ETR. In ETCalc output,
depending on the method of calculation, ETF or ETV notations are used for actual (crop) evapotranspiration,
depending on the type of crop coefficient used for its calculation. ETF is used for the cases when a fixed
crop coefficient has been used (Kfix) and ETV is used for the cases when a variable crop
coefficient has been used (Kvar) respectively.
Input data: this is a dataset consisting of daily weather data and validation data. The
input data has to be uploaded using a file with a fixed number of columns (i.e. 14 columns, with 1 column
for date, 10 columns for weather data and 3 columns for validation data). The columns for which data is not
available can be left blank. For example, if only daily mean air temperature data is available, then only the
column Tmean should have values, with all other columns left blank. The methods for which required data is
not present are disabled by ETCalc. Consult Load Input Data section of the
User Guide for more details regarding the data quality checks included in ETCalc.
In the example above, only Blaney-Criddle (BC) and Thornthwaite (TH) methods will be available for
calculating the evapotranspiration forms.
Validation data: this dataset is part of the Input data file (i.e. the last 3 columns in
the input data file). The validation data provides means for directly comparing any of the data output
from ETCalc with a dataset obtained using different methods or sources. The validation dataset can consist
of evapotranspiration data, but could also consist of other data types such as soil moisture, soil
temperature, groundwater table elevations, etc.
3.2. Crop Coefficients (K)
Depending on the method(s) selected, the direct output from each of the evapotranspiration methods included
in the ETCalc online evapotranspiration calculator is either Potential Evapotranspiration (PET) or Reference
Evapotranspiration (ETR). To obtain actual (crop) evapotranspiration (ET), the crop coefficients (K)
need to be used. Crop coefficients can be interpreted as "land cover" coefficients when evapotranspiration
is estimated in non-agricultural areas. ET is simply the product of the method's direct output (i.e. PET or ETR) and the crop
coefficient (K). It should be noted the meaning of crop coefficients can be slightly different for each of
the methods integrated in ETCalc. Hence, the best practice is to calibrate the crop coefficients separately
for each method. The higher the crop coefficient is, the higher ET will be. ET is always lower than PET;
however, it can be either lower or higher than ETR.
ETCalc provides the option to use either fixed (Kfix) or monthly variable (Kvar) crop
coefficients throughout the year, and these can be different for each of the methods used. In ETCalc, the
resulting actual (crop) evapotranspiration (ET) is denoted either as ETF if a fixed crop coefficient has
been used or as ETV, if a variable crop coefficient has been used. Generally, Kvar would be the
better choice as it allows the crop coefficient to be adjusted in response to, for example, monthly weather
and various growth stages of the plants. However, Kvar values might be more difficult to
obtain and hence, Kfix option is provided if a simplified approach is deemed sufficient for the purpose of
calculating evapotranspiration.
There are currently many sources of crop coefficients values readily available in literature. Typically, in
literature either a single value (e.g. 0.3), a range of values (e.g. 0.2-0.5) or values for beginning, middle
and end of the growing season (e.g. 0.2/0.65/0.2) are provided. In ETCalc initial values for both Kfix
and Kvar are provided; however, the users are encouraged to adjust these values in accordance with
their requirements and conditions of their study area (e.g. change Ks to reflect the crops for which
evapotranspiration is calculated).
For Kfix a single value is provided for the entire year, while for Kvar, ETCalc uses an
interpolation algorithm to calculate Kvar for each month of the year based on values provided by the
user for three key periods: January - February, July-August and December. Once an initial set of values for
Ks(Kfix and/or Kvar) is selected, this set becomes a “reference” set and the Ks for each
of the methods can be obtained by applying a user specified multiplier (i.e. factor) to the Ks used for the
“reference” set. For example if for a selected method the user wishes to use the same K values as the one used
in the reference set, a value of “1” has to be specified for the K multiplier.
3.3. Penman-Monteith Method (PM)
Overview: Penman-Monteith method is a widely used method for estimation of ETR based on a
combination of energy balance and aerodynamic components. This method has been developed by FAO and is recommended
as the standard method for estimating ETR. One disadvantage of the method is that it requires extensive input
data sets and hence, is calculation intensive. For example Penman-Monteith methods requires more than 20 steps
for obtaining ETR compared to up to 4 steps required by other methods included in ETCalc. The Penman-Monteith
formulation used in ETCalc is based on Allen et al. (1998), following the calculation steps outlined in
Zotarrelli et al. (2010) and Cai et al. (2007). In addition, several calibration coefficients (i.e. ac, bc, al,
bl) required for the calculation of the net longwave radiation were incorporated in ETCalc based on the methodology
proposed in Carmona et al. (2017).
Data requirements (daily): Mean air temperature (Tmean); Maximum air temperature (Tmax), Minimum
air temperature (Tmin), Mean air relative humidity (RHmean), Maximum air relative humidity (RHmax), Minimun
air relative humidity (RHmin), Solar Radiation at the surface of the ground (SRSFC) and Wind speed (WND).
ETCalc, in accordance with the methodologies described in the references above, allows for i) use of Tmean
instead of Tmax and Tmin for calculation of mean saturation vapor pressure (es) if Tmax and Tmin are absent or
not reliable; ii) use of RHmean instead of RHmax and RH min for calculation of actual vapor pressure (ea) if
RHmax and RHmin are absent or not reliable; and iii) use of Tmin instead of RHmean for calculation of actual
vapor pressure (ea) if RH data is absent or not reliable.
Data output: Reference Evapotranspiration (ETF and/or ETV), Actual evapotranspiration (ET) (using crop coefficients).
Formula:
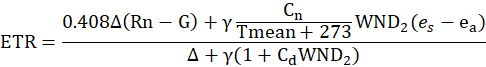


Where:
ETR - daily reference evapotranspiration (mm day-1)
SRSFC - daily solar radiation incident on a horizontal surface at the surface of the earth (MJm-2 day-1)
RHmean - daily mean air relative humidity (%)
RHmax - daily maximum air relative humidity (%)
Rh mean - daily minimum air relative humidity (%)
Tmax - daily maximum air temperature (oC)
Tmean - daily mean air temperature (oC)
Tmin - daily minimum air temperature (oC)
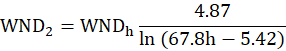
WNDh - daily wind speed measured at h m above the ground (m s-1)
a - albedo or canopy reflection coefficient
ac - FAO calibration coefficient 3 (1.35)
al - FAO calibration coefficient 1 (0.34)
bc - FAO calibration coefficient 4 (-0.35)
bl - FAO calibration coefficient 2 (-0.14)
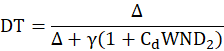
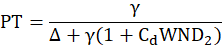
Cd - the denominator constant for the reference crop type and time step
Cn - numerator constant for the reference crop type and time step
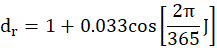
dr - daily inverse relative distance Earth-Sun
DT - daily Delta Term (DT) (part of calculations for Radiation Term)
ea - daily mean actual vapour pressure (kPa)
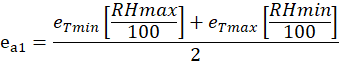
ea1 - daily mean actual vapour pressure (kPa) [used as ea when RH max and RH min are available and reliable]
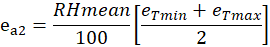
ea2 - daily mean actual vapour pressure (kPa) [used as ea when RH max and RH min are absent or not reliable]
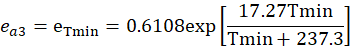
ea3 - daily mean actual vapour pressure (kPa) [used as ea when RH data is absent or not reliable]
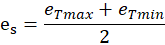
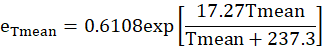
es - daily mean vapour pressure of the air at saturation (kPa)
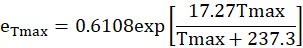
eTmax - daily saturation vapour pressure at the mean daily maximum air temperature (kPa)
eTmean- daily saturation vapour pressure at the daily mean air temperature (kPa) [used as es if Tmax and Tmin are absent or not reliable)
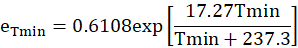
eTmin - daily saturation vapor pressure at the mean daily minimum air temperature (kPa)
ETrad - daily radiative component (mm day-1)
ETaero - daily aerodynamic component (mm day-1)
G - daily soil heat flux density (MJ m-2 day-1) [G may be ignored for daily time step computation]
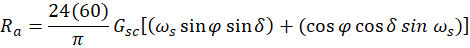
GSC - solar constant (0.082 MJ m-2 min-1)
h - height of wind speed measurement above the ground surface (m)
J - day-of-year number (i.e. day number of the day in the year; 1 to 365 or 366)
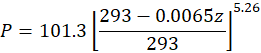
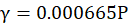
P - atmospheric pressure (kPa)
PT - daily Psi Term (PT) (part of calculations for Wind Term)
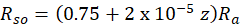
Ra - daily extraterrestrial radiation (MJ m-2 day-1)
Rn - daily net radiation flux (MJ m-2 day-1)
Rng - daily net radiation (Rn) in equivalent of evaporation (mm)
Rnl - daily net outgoing longwave radiation (MJ m-2 day-1)
Rns - daily net solar or shortwave radiation (MJ m-2 day-1)
Rso - daily clear sky solar radiation (MJ m-2 day-1)
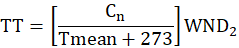
TT - daily Temperature Term (TT) (part of calculations for Wind Term)
WND2 - daily wind speed 2 m above the ground surface (m s-1)
z - elevation above sea level at the location (m)
γ - psychrometric constant (kPa oC-1)
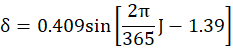
δ - daily solar declination (rad)
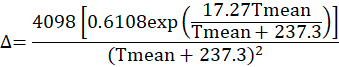
∆ - daily slope of the vapor pressure curve (kPa oC-1)
σ - Stefan-Boltzmann constant (4.903 x 10⁻⁹ MJ K-4 m-2 day-1)
ϕ - latitude of the location (rad)
ωs - daily sunset hour angle (rad)
ETR - daily reference evapotranspiration (mm day-1)
SRSFC - daily solar radiation incident on a horizontal surface at the surface of the earth (MJm-2 day-1)
RHmean - daily mean air relative humidity (%)
RHmax - daily maximum air relative humidity (%)
Rh mean - daily minimum air relative humidity (%)
Tmax - daily maximum air temperature (oC)
Tmean - daily mean air temperature (oC)
Tmin - daily minimum air temperature (oC)
WNDh - daily wind speed measured at h m above the ground (m s-1)
a - albedo or canopy reflection coefficient
ac - FAO calibration coefficient 3 (1.35)
al - FAO calibration coefficient 1 (0.34)
bc - FAO calibration coefficient 4 (-0.35)
bl - FAO calibration coefficient 2 (-0.14)
Cd - the denominator constant for the reference crop type and time step
Cn - numerator constant for the reference crop type and time step
dr - daily inverse relative distance Earth-Sun
DT - daily Delta Term (DT) (part of calculations for Radiation Term)
ea - daily mean actual vapour pressure (kPa)
ea1 - daily mean actual vapour pressure (kPa) [used as ea when RH max and RH min are available and reliable]
ea2 - daily mean actual vapour pressure (kPa) [used as ea when RH max and RH min are absent or not reliable]
ea3 - daily mean actual vapour pressure (kPa) [used as ea when RH data is absent or not reliable]
es - daily mean vapour pressure of the air at saturation (kPa)
eTmax - daily saturation vapour pressure at the mean daily maximum air temperature (kPa)
eTmean- daily saturation vapour pressure at the daily mean air temperature (kPa) [used as es if Tmax and Tmin are absent or not reliable)
eTmin - daily saturation vapor pressure at the mean daily minimum air temperature (kPa)
ETrad - daily radiative component (mm day-1)
ETaero - daily aerodynamic component (mm day-1)
G - daily soil heat flux density (MJ m-2 day-1) [G may be ignored for daily time step computation]
GSC - solar constant (0.082 MJ m-2 min-1)
h - height of wind speed measurement above the ground surface (m)
J - day-of-year number (i.e. day number of the day in the year; 1 to 365 or 366)
P - atmospheric pressure (kPa)
PT - daily Psi Term (PT) (part of calculations for Wind Term)
Ra - daily extraterrestrial radiation (MJ m-2 day-1)
Rn - daily net radiation flux (MJ m-2 day-1)
Rng - daily net radiation (Rn) in equivalent of evaporation (mm)
Rnl - daily net outgoing longwave radiation (MJ m-2 day-1)
Rns - daily net solar or shortwave radiation (MJ m-2 day-1)
Rso - daily clear sky solar radiation (MJ m-2 day-1)
TT - daily Temperature Term (TT) (part of calculations for Wind Term)
WND2 - daily wind speed 2 m above the ground surface (m s-1)
z - elevation above sea level at the location (m)
γ - psychrometric constant (kPa oC-1)
δ - daily solar declination (rad)
∆ - daily slope of the vapor pressure curve (kPa oC-1)
σ - Stefan-Boltzmann constant (4.903 x 10⁻⁹ MJ K-4 m-2 day-1)
ϕ - latitude of the location (rad)
ωs - daily sunset hour angle (rad)
References:
Allen RG, Pereira LS, Raes D, Smith M (1998) Crop Evapotranspiration: Guidelines for Computing Crop Water Requirements. FAO Irrigation and Drainage Paper 56, Rome, 300.
Allen RG, Pereira LS, Raes D, Smith M (1998) Crop Evapotranspiration: Guidelines for Computing Crop Water Requirements. FAO Irrigation and Drainage Paper 56, Rome, 300.
Cai J, Liu Y, Lei T, Pereira LS (2007) Estimating reference evapotranspiration with the FAO Penman-Monteith
equation using daily weather forecast messages. Ag. For. Meteor. 145: 22-35
Carmona F, Rivas R, Kruse E (2017) Estimating daily net radiation in the FAO Penman-Monteith method. Theor. Appl.
Climatol. 129:89-95
Zotarelli L, Dukes MD, Romero CC, Migliaccio KW, Morgan KT (2010) Step by Step Calculation of the Penman-Monteith
Evapotranspiration (FAO-56 Method). AE459. Agricultural and Biological Engineering Department, Florida Cooperative
Extension Service, IFAS, UF. URL: http://edis.ifas.ufl.edu/ae459, 12 pgs.
3.4. Thornthwaite Method (TH)
Overview: This is a simple method which requires only mean air temperature data. Being one
of the older methods for estimating evapotranspiration, it considers only air temperature as this was the only
variable that could be measured with high accuracy at the time. Hence, it has
limited applicability in climate change studies as it is not able to account for trends in, for example, wind
speed, air humidity and/or radiative balance.
Previous research suggested that Thornthwaite method might underestimate evapotranspiration under arid
conditions while overestimating it under equatorial humid regions. Hence, an adaptation of this method
(i.e. Wilmott adaptation) has been developed for reducing this bias when air temperature is above 26
oC. Although the method has been initially used with monthly data, a correction factor for applying
the method to daily data has been developed.
Data requirements (daily): Mean air temperature (Tmean).
Data output: Reference Evapotranspiration (ETF and/or ETV), Actual evapotranspiration (ET)
(using crop coefficients).
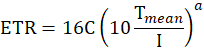
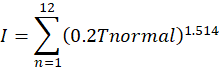
Formula:


If Tmean ≤ 0 oC
If 0 oC ≤ Tmean ≤ 26 oC
If Tmean > 26 oC
Where:
C - correction factor from converting from monthly to daily time scale
N - duration of the photoperiod (h)
ETR - daily reference evapotranspiration (mm day-1)
Tmean - daily mean air temperature (oC)
I - thermal index
a - exponent
Tnormal - local normal climatic temperature (oC)
C - correction factor from converting from monthly to daily time scale
N - duration of the photoperiod (h)
ETR - daily reference evapotranspiration (mm day-1)
Tmean - daily mean air temperature (oC)
I - thermal index
a - exponent
Tnormal - local normal climatic temperature (oC)
References:
McKenney MS, Rosenberg NJ (1993) Sensitivity of some potential evapotranspiration estimation methods to
climate change. Agric. For. Meteorol. 64, 81-110.
McVicar TR, Roderick ML, Donohue RJ, Li LT, Van Niel TG, Thomas A, Grieser J, Jhajharia D, Himri Y, Mahowald
NM, Mescherskaya AV, Kruger AC, Rehman S, Dinpashoh Y (2012) Global review and synthesis of trends in
observed terrestrial near-surface wind speeds: Implications for evaporation. Journal of Hydrology. 416-417:
182-205
Pereira AR, Pruitt WO (2004) Adaptation of the Thornthwaite scheme for
estimating daily reference evapotranspiration. Ag. Wat. Manag. 66: 251-257.
Thornthwaite CW (1948) An approach toward a rational classification of climate. Geogr. Rev. 38: 55-94.
Willmott CJ, Rowe C., Mintz Y (1985) Climatology of the terrestrial seasonal water cycle. J. Climatol. 5:
589-606.
3.5. Blaney-Criddle Method (BC)
Overview: This is a simple method, which uses only mean air temperature data. Similar to the Thornthwaite method, it has limited applicability in climate change studies as it is not able to account for trends in, for example, wind speed, air humidity and/or radiative balance. As shown in other studies the Blaney-Criddle method can provide reliable estimates for moderate climates, however, it could underestimate evapotranspiration for windy, dry, sunny conditions and overestimate it for calm, humid, clouded areas.
Data requirements (daily): Mean air temperature (Tmean);
Data output: Reference Evapotranspiration (ETF and/or ETV), Actual evapotranspiration (ET)
(using crop coefficients).
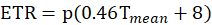
Formula:
Where:
ETR - daily reference evapotranspiration (mm day-1)
p - mean daily percentage of annual daytime hours
Tmean - daily mean air temperature (oC)
ETR - daily reference evapotranspiration (mm day-1)
p - mean daily percentage of annual daytime hours
Tmean - daily mean air temperature (oC)
| Latitude | North | Jan | Feb | Mar | Apr | May | Jun | Jul | Aug | Sep | Oct | Nov | Dec |
|---|---|---|---|---|---|---|---|---|---|---|---|---|---|
| South | Jul | Aug | Sep | Oct | Nov | Dec | Jan | Feb | Mar | Apr | May | Jun | |
| 60° | 0.15 | 0.20 | 0.26 | 0.32 | 0.38 | 0.41 | 0.40 | 0.34 | 0.28 | 0.22 | 0.17 | 0.13 | |
| 55° | 0.17 | 0.21 | 0.26 | 0.32 | 0.36 | 0.39 | 0.38 | 0.33 | 0.28 | 0.23 | 0.18 | 0.16 | |
| 50° | 0.19 | 0.23 | 0.27 | 0.31 | 0.34 | 0.36 | 0.35 | 0.32 | 0.28 | 0.24 | 0.20 | 0.18 | |
| 45° | 0.20 | 0.23 | 0.27 | 0.30 | 0.34 | 0.35 | 0.34 | 0.32 | 0.28 | 0.24 | 0.21 | 0.20 | |
| 40° | 0.22 | 0.24 | 0.27 | 0.30 | 0.32 | 0.34 | 0.33 | 0.31 | 0.28 | 0.25 | 0.22 | 0.21 | |
| 35° | 0.23 | 0.25 | 0.27 | 0.29 | 0.31 | 0.32 | 0.32 | 0.30 | 0.28 | 0.25 | 0.23 | 0.22 | |
| 30° | 0.24 | 0.25 | 0.27 | 0.29 | 0.31 | 0.32 | 0.31 | 0.30 | 0.28 | 0.26 | 0.24 | 0.23 | |
| 25° | 0.24 | 0.26 | 0.27 | 0.29 | 0.30 | 0.31 | 0.31 | 0.29 | 0.28 | 0.26 | 0.25 | 0.24 | |
| 20° | 0.25 | 0.26 | 0.27 | 0.28 | 0.29 | 0.30 | 0.30 | 0.29 | 0.28 | 0.26 | 0.25 | 0.25 | |
| 15° | 0.26 | 0.26 | 0.27 | 0.28 | 0.29 | 0.29 | 0.29 | 0.28 | 0.28 | 0.27 | 0.26 | 0.25 | |
| 10° | 0.26 | 0.27 | 0.27 | 0.28 | 0.28 | 0.29 | 0.29 | 0.28 | 0.28 | 0.27 | 0.26 | 0.26 | |
| 5° | 0.27 | 0.27 | 0.27 | 0.28 | 0.28 | 0.28 | 0.28 | 0.28 | 0.28 | 0.27 | 0.27 | 0.27 | |
| 0° | 0.27 | 0.27 | 0.27 | 0.27 | 0.27 | 0.27 | 0.27 | 0.27 | 0.27 | 0.27 | 0.27 | 0.27 |
References:
Brouwer C, Heibloem M (1986) Irrigation Water Management: Irrigation Water Needs. Part II - Determination of Irrigation Water Needs. FAO Irrigation Water Management. Training manual No. 3, FAO, Land and Water Development Division, Rome, Italy.
Brouwer C, Heibloem M (1986) Irrigation Water Management: Irrigation Water Needs. Part II - Determination of Irrigation Water Needs. FAO Irrigation Water Management. Training manual No. 3, FAO, Land and Water Development Division, Rome, Italy.
Blaney HF, Criddle WD (1950) Determining water requirements in irrigated areas from climatological and irrigation
data. United States Department of Agriculture, Soil Conservation Service.
McKenney MS, Rosenberg NJ (1993) Sensitivity of some potential evapotranspiration estimation methods to climate change. Agric. For. Meteorol. 64, 81-110.
McVicar TR, Roderick ML, Donohue RJ, Li LT, Van Niel TG, Thomas A, Grieser J, Jhajharia D, Himri Y, Mahowald NM, Mescherskaya AV, Kruger AC, Rehman S, Dinpashoh Y (2012) Global review and synthesis of trends in observed terrestrial near-surface wind speeds: Implications for evaporation. Journal of Hydrology. 416-417: 182-205
3.6. Turc Method (TU)


Overview: This is an energy balance-based method which uses mean air relative temperature,
solar radiation and air relative humidity. The method has been modified in ETCalc by introducing an additional
condition (i.e., ET=0 if Tmean<0) to prevent the formula from yielding negative ET values at temperatures
below 0 oC.
Data requirements (daily): Mean air temperature (Tmean); Solar Radiation at the surface of the
ground (SRSFC), Mean air relative humidity (RHmean).
Data output: Potential Evapotranspiration (PET), Actual evapotranspiration (ETF and/or ETV).
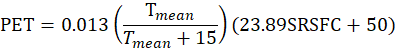
Formula:
If Tmean<0oC:
If Tmean>0oC and RH<50%:
If Tmean>0oC and RH>50%:
Where:
PET - daily Potential evapotranspiration (mm day-1)
Tmean - daily mean air temperature (oC)
SRSFC - daily solar radiation incident on a horizontal surface at the surface of the earth (MJm−2 day−1)
RHmean - daily mean air relative humidity (%)
PET - daily Potential evapotranspiration (mm day-1)
Tmean - daily mean air temperature (oC)
SRSFC - daily solar radiation incident on a horizontal surface at the surface of the earth (MJm−2 day−1)
RHmean - daily mean air relative humidity (%)
References:
Amatya DM, Harriso CA (2016) Grass and Forest Potential Evapotranspiration Comparison Using Five Methods in the Atlantic Coastal Plain. J. Hydrol. Eng. 05016007.
Amatya DM, Harriso CA (2016) Grass and Forest Potential Evapotranspiration Comparison Using Five Methods in the Atlantic Coastal Plain. J. Hydrol. Eng. 05016007.
Turc L (1961) Estimation of irrigation water requirements, potential evapotranspiration: A simple climatic
formula evolved up to date. J. Ann. Agron., 12: 13-14 (in French).
3.7. Priestley-Taylor Method (PT)


Overview: This is physically-based formulation, which could be interpreted as a
simplified version of the Penman - Monteith formula for calculating evapotranspiration. This simplification
has been achieved by removing the aerodynamic terms from the Penman-Monteith equation and by using a constant
(i.e. α). This constant has been derived empirically and is considered to be higher for arid areas or areas
with significant water stress. The Priestley-Taylor formula can be used for calculating daily evapotranspiration,
but can also be used for smaller time-steps (i.e. hourly) provided the required data is available.
Data requirements (daily): Mean air temperature (Tmean); Solar Radiation
at the surface of the ground (SRSFC).
Data output: Potential Evapotranspiration (PET), Actual evapotranspiration (ETF and/or ETV).
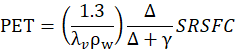
Formula:
If Tmean<0oC
If Tmean>0oC
Where:
PET - daily potential evapotranspiration (mm day-1)
λv - latent heat of vaporization (2260 kJ kg-1)
ρw - density of water (1000 kg m-3)
Δ - slope of the saturation vapor density curve from the psychrometric chart (kg oC-1)
γ - psychrometric constant (4.95x10⁻⁴ kg m-3 oC-1)
Tmean - daily mean air temperature (oC)
SRSFC - daily solar radiation incident on a horizontal surface at the surface of the earth (kJ m−2)
References:
Priestley CHB, Taylor RJ (1972) On the assessment of the surface heat flux and evaporation using large-scale parameters. Mon. Weather Rev 100: 81-92.
Priestley CHB, Taylor RJ (1972) On the assessment of the surface heat flux and evaporation using large-scale parameters. Mon. Weather Rev 100: 81-92.
Jensen ME, Burman RD, Allen RG (1990) Evapotranspiration and Irrigation Water Requirement. ASCE Manuals and
Reports on Engineering Practices. Vol. 70. New York, NY: American Society of Civil Engineers. ISBN 978-0-87262-763-5.
3.8. Hargreaves Method (HA)

Overview: Hargreaves formula provides a simple method for calculating evapotranspiration
based on an empirical relationship involving temperature and solar radiation. Allen et al. (1998) suggest that
the Hargreaves formula could underpredict ETR under high wind (> 3 m/s) conditions and overpredict ETR under
high relative humidity conditions.
Data requirements (daily): Mean air temperature (Tmean); Maximum air temperature (Tmax),
Minimum air temperature (Tmin), Solar Radiation at the top of atmosphere (SRTOA).
Data output: Reference Evapotranspiration (ETR), Actual evapotranspiration (ETF and/or ETV).
Formula:
Where:
ETR - daily reference evapotranspiration (m day-1)
Cf - conversion factor (0.0023)
Tmean - daily mean air temperature (oC)
Tmax - daily maximum air temperature (oC)
Tmin - daily minimum air temperature (oC)
SRTOA - daily solar radiation incident on the top-of-atmosphere (MJ m-2 day-1)
ETR - daily reference evapotranspiration (m day-1)
Cf - conversion factor (0.0023)
Tmean - daily mean air temperature (oC)
Tmax - daily maximum air temperature (oC)
Tmin - daily minimum air temperature (oC)
SRTOA - daily solar radiation incident on the top-of-atmosphere (MJ m-2 day-1)
References:
Allen RG, Pereira LS, Raes D, Smith M (1998) Crop Evapotranspiration: Guidelines for Computing Crop Water Requirements. FAO Irrigation and Drainage Paper 56, Rome, 300.
Allen RG, Pereira LS, Raes D, Smith M (1998) Crop Evapotranspiration: Guidelines for Computing Crop Water Requirements. FAO Irrigation and Drainage Paper 56, Rome, 300.
Hargreaves GH, Allen RG (2003) History and evaluation of Hargreaves evapotranspiration equation. J Irring
Drain Engine. 129: 53-63..
3.9. Jensen-Haise Method (JH)
Overview: Jensen-Haise (McGuiness model) formula provides a method for calculating
evapotranspiration based on daily temperature and solar radiation. By including the solar radiation term,
Jensen-Haise method represents an improvement over the methods based only on temperature.
Data requirements (daily): Solar Radiation at the top of atmosphere (SRTOA), Mean air
temperature (Tmean).
Data output: Potential Evapotranspiration (PET), Actual evapotranspiration (ETF and/or ETV).
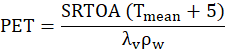
Formula:
Where:
PET - daily potential evapotranspiration (m day-1)
SRTOA - daily solar radiation incident on the top-of-atmosphere (MJ m-2 day-1)
Tmean - daily mean air temperature (oC)
λ - latent heat of vaporization (2260 kJ kg-1)
ρ - density of water (1000 kg m-3)
PET - daily potential evapotranspiration (m day-1)
SRTOA - daily solar radiation incident on the top-of-atmosphere (MJ m-2 day-1)
Tmean - daily mean air temperature (oC)
λ - latent heat of vaporization (2260 kJ kg-1)
ρ - density of water (1000 kg m-3)
References:
Tegos A, Efstratiadis A, Koutsoyiannis D. (2013) A Parametric Model for Potential Evapotranspiration Estimation Based on a Simplified Formulation of the Penman-Monteith Equation. In Evapotranspiration - an overview, Alexandris S (ed.), IntechOpen, eBook ISBN: 978-953-51-5369-6.
Tegos A, Efstratiadis A, Koutsoyiannis D. (2013) A Parametric Model for Potential Evapotranspiration Estimation Based on a Simplified Formulation of the Penman-Monteith Equation. In Evapotranspiration - an overview, Alexandris S (ed.), IntechOpen, eBook ISBN: 978-953-51-5369-6.
Jensen M, Haise H (1963) Estimating evapotranspiration from solar radiation. Journal of the Irrigation and
Drainage Division. Proceedings of the ASCE 1963; 89: 15-41.
McGuinness JL, Bordne EF (1972) A comparison of lysimeter-derived potential evapotranspiration with computed
values. Technical Bulletin 1452. Agricultural Research Service, US Department of Agriculture, Washington, DC.
3.10. Abtew Method (AB)
Overview: Abtew method for calculation of evapotranspiration is a simplified
energy-based formulation that requires only solar radiation. Abtew method is the only method included in
ETCalc that does not require temperature data. K1 coefficient has been derived empirically based on
several land covers/vegetation types and hence can be adjusted accordingly.
Data requirements (daily): Solar radiation incident on a horizontal surface at the surface of
the earth (SRSFC).
Data output: Potential Evapotranspiration (PET), Actual evapotranspiration (ETF and/or ETV).
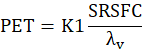
Formula:
Where:
PET - daily potential evapotranspiration (m day-1)
K1 - dimensionless coefficient (0.53)
SRSFC - daily solar radiation incident on a horizontal surface at the surface of the earth (MJ m-2 day-1)
λ - latent heat of vaporization (2.45 MJ kg-1)
PET - daily potential evapotranspiration (m day-1)
K1 - dimensionless coefficient (0.53)
SRSFC - daily solar radiation incident on a horizontal surface at the surface of the earth (MJ m-2 day-1)
λ - latent heat of vaporization (2.45 MJ kg-1)
Reference: Abtew W (1996) Evapotranspiration measurements and modeling for three
wetland systems in south Florida. J. Am. Water Resour. Assoc. 32: 465-473.
For detailed instructions on how to use the evapotranspiration online calculator please refer to the User Guide
section.
3.11. Input and Validation Data
Input data: this is a dataset consisting of daily weather data and validation data.
The input data has to be uploaded using a Comma Separated Values (csv) file with a fixed number of columns
(i.e. 14 columns, with 1 column for date, 10 columns for weather data and 3 columns for validation data).
The columns for which data is not available can be left blank. For example, if only daily mean air
temperature data is available, then only the column Tmean should have values, with all other columns
(except calendar date) left blank. The methods for which required data is not present are disabled by ETCalc.
For the example above (i.e., only Tmean available), only Blaney-Criddle (BC) and Thornthwaite (TH) methods
will be available for calculating the evapotranspiration forms. Consult
Load Input Data section of the User Guide for more details
regarding
the data quality checks included in ETCalc.
The table below shows the weather data required for each of the methods currently included in the ETCalc
online evapotranspiration calculator.
| Method | PP | Tmean | Tmax | Tmin | RHmean | RHmax | RHmin | SRTOA | SRSFC | WND |
|---|---|---|---|---|---|---|---|---|---|---|
| Penman-Monteith (PM) | n.a. | ✓ | Opt. | Opt. | Opt. | Opt. | Opt. | n.a. | ✓ | ✓ |
| Thornthwaite (TH) | n.a. | ✓ | n.a. | n.a. | n.a. | n.a. | n.a. | n.a. | n.a. | n.a. |
| Blaney - Criddle (BC) | n.a. | ✓ | n.a. | n.a. | n.a. | n.a. | n.a. | n.a. | n.a. | n.a. |
| Turc (TU) | n.a. | ✓ | n.a. | n.a. | ✓ | n.a. | n.a. | n.a. | ✓ | n.a. |
| Priestley - Taylor (PT) | n.a. | ✓ | n.a. | n.a. | n.a. | n.a. | n.a. | n.a. | ✓ | n.a. |
| Hargreaves (HA) | n.a. | ✓ | ✓ | ✓ | n.a. | n.a. | n.a. | ✓ | n.a. | n.a. |
| Jensen - Haise (JH) | n.a. | ✓ | n.a. | n.a. | n.a. | n.a. | n.a. | ✓ | n.a. | n.a. |
| Abtew (AB) | n.a. | n.a. | n.a. | n.a. | n.a. | n.a. | n.a. | n.a. | ✓ | n.a. |
*Notations: ✓ - required data; n.a. - not applicable; Opt. - optional data [user units]; PP - daily total
precipitation [mm/d]
(Note: PP is not currently used by any of the ETCalc methods; PP could be included in the user input data if
comparison with ETCalc output is of interest); Tmean - daily mean air temperature [°C]
Tmax - daily maximum air temperature [°C]; Tmin - daily minimum air temperature [°C]; RHmean - daily mean
air relative [%]
humidity; RHmax - daily maximum air relative humidity [%]; RHmin - daily minimum air relative humidity [%];
SRTOA -
daily solar radiation @ top-of-atmosphere [MJ/m2/d].; SRSFC - daily solar radiation @ surface of the
ground [MJ/m2/d];
WND - daily wind speed [m/s]
Validation data: In addition to the weather data, the user can include validation
data in the input dataset. The last three columns of the input file are reserved for the validation
dataset. Validation data provides means for directly comparing any of the data output from ETCalc with
a dataset obtained using different methods or sources. The validation data set can include evapotranspiration
data, but could also include other data types such as soil moisture, soil temperature, groundwater table
elevations, etc.
The column headers and the units of the various weather parameters required for the input file are shown
in the table below.
| Date | PP | Tmean | Tmax | Tmin | RHmean | RHmax | RHmin | SRTOA | SRSFC | WND | VAL1 | VAL2 | VAL3 |
|---|---|---|---|---|---|---|---|---|---|---|---|---|---|
| yyyy-mm-dd | mm/d | °C | °C | °C | % | % | % | MJ/m²/d | MJ/m²/d | m/s | ? | ? | ? |
*Notes:
- Input file must be in Comma Separated Values (csv) format. Open the input file with a text editor (e.g. Notepad) before uploading it to ETCalc and remove all the empty rows found (if any) after the last row with data.
- Columns in the input file have to be in the same order as shown in the tabl above
- Columns have to be left blank for parameters for which data is not present
- The first row in the input data file has to contain the column headers as specified in the table above. ETCalc will replace the information supplied in the first row of the input file with the column headers shown above
- The data records start in the second row of the input file (i.e., a row for the units is not required).
- ETCalc allows uploading of files with maximum 7500 rows (~20 years of daily data). It is recommended to split the input data set in blocks of 20 years daily timeseries when the intent is to analyze longer time periods
- ETCalc will select the calculation methods that are available to the user based on the columns with valid data. Absence of values for PP, VAL1, VAL2, VAL3 will not impact method availability. Consult Load Input Data section of the User Guide for more details regarding the data quality checks included in ETCalc.
- Data in columns VAL1, VAL2 and VAL3 are used for comparison of ETCalc results with the data in the respective columns (i.e. if Val columns are not left blank). ETCalc does not require specific measurement units for the validation data.
For detailed instructions on how to use the evapotranspiration online calculator please refer to the User Guide
section.
4. User Guide
ETCalc is a web application that allows for the calculation of daily values of various evapotranspiration forms (Potential
evapotranspiration - PET, Reference evapotranspiration - ETR, Actual (or crop) evapotranspiration - ET) based on user
provided weather data and crop coefficients (Kfix, Kvar). Currently, ETCalc includes 8
methods already published and which have been selected following extensive literature research. The tool provides functionality
for tabular and graphical representations of the input data (weather data and validation data), output data (PET, ETR, ET),
comparison with validation data (included in the input data file), calculation of representative statistics and export of all
data types (i.e. input data, output data, metadata).
On the left, a contextual menu provides access to the various components of the tool. At the top of the
page, a progress bar displays the status of the analysis.
4.1. Quick Start
In order to run ETCalc the user has to complete the following steps:
- Load Input Data: provide required data [Source Data Menu];
- Perform Evapotranspiration Calculations: choose Crop Coefficients, Select ET methods and Run ETCalc [Analyze Menu];
- Investigate Results and Export Data: Review ETCalc output and export results [Output Data Menu].
The steps required for using this tool are described in more detail below.
4.2. Load Input Data
The first step in any analysis is to upload the Input Data file to be used by the online
evapotranspiration calculator. The tool accepts source data sets in Comma Separated Values file (csv)
format. The dataset has a fixed number of columns (i.e. 14 columns), with 1 column for date, 10 columns
for weather data and 3 columns for validation data).
The daily weather data includes total precipitation, mean air temperature, maximum air temperature,
minimum air temperature, mean air relative humidity, maximum air relative humidity, minimum air
relative humidity, solar radiation incident on the top-of-atmosphere, solar radiation incident on
a horizontal surface at the surface of the earth and wind speed. The validation datasets are optional
and provide means for directly comparing any of the data output from ETCalc with a dataset obtained
using different methods or sources. The validation dataset can consist of evapotranspiration data,
but could also consist of other data types such as soil moisture, soil temperature, groundwater
table elevations, etc.
Not all the columns are required to contain data - ETCalc selects which methods for calculating evapotranspiration
can be used based on the columns that contain valid data. Precipitation is not used by any of the evapotranspiration
calculation methods and hence, blank values in the precipitation column will not impact the availability of the methods.
The input data file can be uploaded using the Upload User Data menu entry under the SOURCE DATA menu section.
Alternatively, for a better understanding of ETCalc routines, the user can use the sample data set
provided by using the Load Sample Data menu entry. The test dataset contains two years of daily required data
and validation data for a research site located at the Agriculture and Agri-Food Canada (AAFC) Harrington
Experimental Farm (Charlottetown, Prince Edward Island, Canada). The validation data included in the test
dataset consists of daily potential / reference evapotranspiration (VAL1), actual evapotranspiration using
fixed crop coefficients (VAL2) and actual evapotranspiration using variable crop coefficients (VAL3) obtained
for the above location.
The table below shows the weather data required for each of the methods currently included in the ETCalc
online evapotranspiration calculator. ETCalc selects which methods will be available for calculating the
evapotranspiration forms based on the datasets that are uploaded (i.e. the user should leave the columns
blank for the data that is not available). The methods for which required data is not present are disabled
by ETCalc. Consult “Timeseries data integrity and quality check” in this section for more details regarding
the management of invalid entries by ETCalc.
In addition to the daily weather data, the input file can also contain daily validation data (the last
three columns of the input file). Validation data provides means for directly comparing any of the data
output from ETCalc with a dataset obtained using different methods or sources. The validation data set
can include evapotranspiration data, but could also include other data types such as soil moisture, soil
temperature, groundwater table elevations, etc.
| Method | PP | Tmean | Tmax | Tmin | RHmean | RHmax | RHmin | SRTOA | SRSFC | WND |
|---|---|---|---|---|---|---|---|---|---|---|
| Penman-Monteith (PM) | n.a. | ✓ | Opt. | Opt. | Opt. | Opt. | Opt. | n.a. | ✓ | ✓ |
| Thornthwaite (TH) | n.a. | ✓ | n.a. | n.a. | n.a. | n.a. | n.a. | n.a. | n.a. | n.a. |
| Blaney - Criddle (BC) | n.a. | ✓ | n.a. | n.a. | n.a. | n.a. | n.a. | n.a. | n.a. | n.a. |
| Turc (TU) | n.a. | ✓ | n.a. | n.a. | ✓ | n.a. | n.a. | n.a. | ✓ | n.a. |
| Priestley - Taylor (PT) | n.a. | ✓ | n.a. | n.a. | n.a. | n.a. | n.a. | n.a. | ✓ | n.a. |
| Hargreaves (HA) | n.a. | ✓ | ✓ | ✓ | n.a. | n.a. | n.a. | ✓ | n.a. | n.a. |
| Jensen - Haise (JH) | n.a. | ✓ | n.a. | n.a. | n.a. | n.a. | n.a. | ✓ | n.a. | n.a. |
| Abtew (AB) | n.a. | n.a. | n.a. | n.a. | n.a. | n.a. | n.a. | n.a. | ✓ | n.a. |
*Notations: ✓ - required data; n.a. - not applicable; Opt. - optional data [user units]; PP - daily total
precipitation [mm/d]
(Note: PP is not currently used by any of the ETCalc methods; PP could be included in the user input data if
comparison with ETCalc output is of interest); Tmean - daily mean air temperature [°C]
Tmax - daily maximum air temperature [°C]; Tmin - daily minimum air temperature [°C]; RHmean - daily mean
air relative [%]
humidity; RHmax - daily maximum air relative humidity [%]; RHmin - daily minimum air relative humidity [%];
SRTOA -
daily solar radiation @ top-of-atmosphere [MJ/m2/d].; SRSFC - daily solar radiation @ surface of the
ground [MJ/m2/d];
WND - daily wind speed [m/s]
The column headers and the units of the various weather parameters required for the input file are shown
in the table below.
| Date | PP | Tmean | Tmax | Tmin | RHmean | RHmax | RHmin | SRTOA | SRSFC | WND | VAL1 | VAL2 | VAL3 |
|---|---|---|---|---|---|---|---|---|---|---|---|---|---|
| yyyy-mm-dd | mm/d | °C | °C | °C | % | % | % | MJ/m²/d | MJ/m²/d | m/s | ? | ? | ? |
*Notes:
- Input file must be in Comma Separated Values (csv) format. Open the input file with a text editor (e.g. Notepad) before uploading it to ETCalc and remove all the empty rows found (if any) after the last row with data.
- Columns in the input file have to be in the same order as shown in the tabl above
- Columns have to be left blank for parameters for which data is not present
- The first row in the input data file has to contain the column headers as specified in the table above. ETCalc will replace the information supplied in the first row of the input file with the column headers shown above
- The data records start in the second row of the input file (i.e., a row for the units is not required).
- ETCalc allows uploading of files with maximum 7500 rows (~20 years of daily data). It is recommended to split the input data set in blocks of 20 years daily timeseries when the intent is to analyze longer time periods
- ETCalc will select the calculation methods that are available to the user based on the columns with valid data. Absence of values for PP, VAL1, VAL2, VAL3 will not impact method availability. Consult Load Input Data section of the User Guide for more details regarding the data quality checks included in ETCalc.
- Data in columns VAL1, VAL2 and VAL3 are used for comparison of ETCalc results with the data in the respective columns (i.e. if Val columns are not left blank). ETCalc does not require specific measurement units for the validation data.
Once the input dataset is loaded to ETCalc, a series of options become available in the SOURCE DATA menu
section. These allow for investigation of the input data (i.e. weather and validation data) using a tabular
format (Table View) as well as for visualization of the various time series (Graphical View). The Graphical
View allows for inspection of the full data set or of a reduced subset by changing the beginning and the
ending values of the time interval that is displayed. In the Graphical View, the user can select which
parameters to be displayed, on which Y axis (i.e. left/primary or right/secondary), and what colors to be
used for each of the datasets (i.e. parameters). Once the selections are completed the user can use the
Update Graph button to display the data. Statistics for both the entire dataset and the selected subset
are shown in Table View.
TIMESERIES DATA INTEGRITY AND QUALITY CHECK
ETCalc includes data integrity and quality checks routines for detecting values that are out of range
(OOR; see table below), missing (MVal) and incorrect format data (INCF) in the input file. If errors
in the input file are detected, an on-screen error log including the number and type of errors for each
column (“Error: Statistics”) and the first 20 errors is shown (“Error: Details”). Depending on the errors
detected the users are allowed to either proceed to the calculation of the evapotranspiration forms or
return to the Upload User Data Page if the errors result only in disabling of some of the evapotranspiration
calculation methods; or are only allowed to return to the Upload User Data page if the errors do not allow
for any of the ETCalc methods to be used. ETCalc will mark all cells that do not pass the data integrity and
quality check with NULL and will also disable the columns containing NULL values from the Graphical View.
It is recommended that the user verifies the integrity of the source data before uploading. Consult table
below for allowed ranges of values in the input timeseries. See Perform
Evapotranspiration Calculations section for the range of values for the various coefficients used in the
Analysis page.
| Input Data | Min. | Max. | Units |
|---|---|---|---|
| Daily total precipitation (PP) | 0 | 1500 | mm/day |
| Daily mean air temperature (Tmean) | -40 | 50 | oC |
| Daily maximum air temperature (Tmax) | -45 | 50 | oC |
| Daily minimum air temperature (Tmin) | -70 | 50 | oC |
| Daily mean relative humidity (RHmean) | 0 | 100 | % |
| Daily maximum relative humidity (RHmax) | 0 | 100 | % |
| Daily minimum relative humidity (RHmin) | 0 | 100 | % |
| Daily solar radiation @ top-of-atmosphere (SRTOA) | 0 | 150 | MJ/m2/day |
| Daily solar radiation @ surface of the ground (SRSFC) | 0 | 150 | MJ/m2/day |
| Daily wind speed (WND) | 0 | 70 | m/s |
| VAL1 to VAL3 | -70 | 1500 | ? |
4.3. Perform Evapotranspiration Calculations
Evapotranspiration calculations can be performed once the input data is loaded and the Analyze menu entry
becomes available. Once the user follows Analyze menu link, a page with two subsections becomes available:
i) CROP COEFFICIENTS and II) METHOD SELECTION.
CROP COEFFICIENTS (K)
The crop coefficients can be left unchanged if only the direct output of each of the available methods
(i.e. Potential evapotranspiration or reference evapotranspiration, depending on the method) is of interest.
Crop coefficients should be adjusted if the calculation of actual (crop) evapotranspiration (ET) is of interest.
Crop coefficients are multiplied with the direct output (i.e. PET or ETR) from each of the methods for
obtaining actual (crop) evapotranspiration (ET). Crop coefficients can be interpreted as "land cover"
coefficients when evapotranspiration is estimated in non-agricultural areas. ETCalc provides the option to
use either fixed (Kfix) or monthly variable (Kvar) crop coefficients throughout the
year. The values of Kfix and Kvar can be different for each of the methods used, since
these coefficients might have a slightly different definition for each of the methods. For Kfix a
single value is provided for the entire year, while for Kvar, ETCalc uses an interpolation algorithm
to calculate Kvar for each month based on values provided by the user for three periods of the year: January -
February, July-August and December. Once an initial set of values for Ks (Kfix and/or
Kvar) is selected, this set becomes a "reference" set and the Ks for all methods can be obtained by
applying a user specified multiplier (i.e. factor) to the Ks used for the "reference" set. For example if for
a selected method the user wishes to use the same K set as the one used in the reference set, a value of "1"
has to be specified for the K multiplier. For more details regarding the definition of the crop coefficients,
refer to section 3.2. Crop Coefficients.
METHOD SELECTION
Once the selection of the crop coefficients is complete, the user can proceed to adjusting the parameters
required for each evapotranspiration calculation method. The default values for the constants associated
with each method are identical with the ones used in the references provided for each of the methods, and
hence it Is recommended that caution should be used if these values are to be changed. For some of the methods,
the user is required to provide site-specific values (e.g. latitude for Blaney-Criddle [BC],
elevation of the location for Penman - Monteith [PM], etc.).
ETCalc can run all available methods at once (Run All button at the bottom of the page) or run only the methods
selected by the user (Run Selected button at the bottom of the page). The methods for which required data is missing
or includes erroneous data are disabled by ETCalc and the output from these methods will consist in NULL values. Consult
Load Input Data section for more details regarding the data integrity and
quality checks included in ETCalc.
RANGES OF VALUES FOR COEFFICIENTS
ETCalc provides a default value for the coefficients used by each of the methods; however, the user is allowed to
change these values. Some of these coefficients (i.e., crop coefficients and crop coefficient multipliers, height
of wind measurement, elevation of the site, albedo, geographical coordinates, normal climate temperature) and
options (i.e., use of minimum and maximum temperature, use of mean or minimum and maximum air relative humidity,
type of reference crop, duration of photoperiod) need to be adjusted by the user prior to performing evapotranspiration
calculations. Changing of the values for the other coefficients is recommended only if further calibration and/or
modification of the original formulation of the methods included in ETCalc is of interest. ETCalc checks for the
values changed by the user to be within realistic limits (see table below). If the user-provided value of a coefficient
is outside of these limits, then ETCalc reverts the respective value to the default value.
| Input data | Min. | Max. | Units |
|---|---|---|---|
| Crop Coefficients | |||
| Fixed K | 0.00 | 2.00 | n.a. |
| Variable K | 0.00 | 2.00 | n.a. |
| K Multiplier | 0.00 | 5.00 | n.a. |
| Penman-Monteith (PM) Method | |||
| Height of wind measurement (h) | 0.00 | 20.00 | m |
| Elevation of the site (z) | -100.00 | 8000.00 | m |
| Albedo (a) | 0.00 | 1.00 | n.a. |
| Degrees latitude | -45 | 55 | deg. |
| Minutes latitude | 0 | 59 | min. |
| Numerator const. for ref. crop type (Cn) | 0 | 2000 | n.a. |
| Denominator const. for ref. crop type (Cd) | 0.00 | 1.00 | n.a. |
| FAO calib. coeff. 1 for Rnl (al) | 0.10 | 0.40 | n.a. |
| FAO calib. coeff. 2 for Rnl (bl) | -0.50 | -0.10 | n.a. |
| FAO calib. coeff. 3 for Rnl (ac) | -1.00 | 1.50 | n.a. |
| FAO calib. coeff. 4 for Rnl (bc) | -1.00 | -0.25 | n.a. |
| Thornthwaite (TH) Method | |||
| Normal (average) temp. (Ta) | 2.00 | 20.00 | oC |
| Duration of photoperiod (N) | 0 | 24 | hours |
| Temp. threshold for Willmott adapt. | 24 | 28.00 | oC. |
| Blaney - Criddle (BC) Method | |||
| Degrees latitude | -60.00 | 60.00 | deg. |
| Turc (TU) Method | |||
| No additional coefficients required. | |||
| Priestley - Taylor (PT) Method | |||
| Empirically derived constant (α) | 0.10 | 2.00 | n.a. |
| Latent heat of vaporization (λv) | 1500 | 2000 | kJ kg-1 |
| Density of water (ρw) | 900.0 | 1100.0 | kg m-3 |
| Psychrometric constant (γ) | 1.000 | 10.000 | 10-4 kg m-3 oC |
| Hargreaves (HA) Method | |||
| Conversion factor (Cf) | 0.0010 | 0.0050 | n.a. |
| Jensen - Haise (JH) Method | |||
| Latent heat of vaporization (λv) | 1500 | 3000 | kJ kg-1 |
| Density of water (ρw) | 900.0 | 1100.0 | kg m-3 |
| Abtew (AB) Method | |||
| K (coefficient) | 0.10 | 1.00 | n.a. |
| Latent heat of vaporization (λv) | 1.50 | 3.00 | MJ kg-1 |
4.4. Investigate Results and Export Data
Following completion of the data analysis / evapotranspiration calculation, the tool redirects to the
OUTPUT DATA (Table View) page, where the user can start to investigate the results using the method
tabs located in the upper portion of this page. The user can browse the results
for each method by clicking on each of the respective tabs. The Table View and Graphical View entries in the OUTPUT
DATA menu section become visible only when either Run Selected or Run All has been used at least
once). In a similar fashion as the Graphical View menu entry in SOURCE DATA, The Graphical View in
OUTPUT DATA allows the user to inspect the full data set or only a reduced subset by changing the
beginning and the ending values of the time interval that is displayed. In the Graphical View, the user
can select which parameters are to be displayed, on which Y axis (i.e. left/primary or right/secondary),
and what colors to be used for each of the datasets (i.e parameters). Once the selections are completed
the user can use the Update Graph button to display the data.
The data set resulted from the analysis (i.e. output dataset and metadata), as well as the graphical representations and
statistics relevant for the analysis, can be downloaded by using Export Output Data / Export Metadata /
Download Image buttons in the Table View and Graphical View pages of OUTPUT DATA menu entries. It should be
noted that Export Output Data, results in exporting all columns used by ETCalc (i.e. includes both input
and output data). Export Metadata allows exporting the metadata associated with the dataset, including
crop coefficients and parameters for all the methods used in the analysis.
5. Limitations
a) Large data sets (i.e. over 5000 rows) take longer to load. Please be patient until loading is completed.
Once the loading is complete the user is redirected to either Source Data Table View (if no errors are
detected in the input file) or to the Input file error check page;
b) ETCalc allows uploading of files with maximum 7500 rows (~20 years of daily data). It is recommended to split the input
data set in blocks of 20 years daily timeseries when the intent is to analyze longer time periods.;
c) ETCalc includes input data integrity and quality check routines (see Load Input Data and
Perform Evapotranspiration Calculations sections of the User guide;
however, it is recommended that the user verifies the integrity of the source data before uploading for minimizing the risk
for erroneous output;
d) In most cases the methods included in ETCalc have been developed for specific conditions and might not have been
tested for all available situations (e.g. cold vs. warm climate; arid vs humid climate; extreme weather, etc.). Since
the various methods include a wide range of input requirements and formulations and each method might be biased towards
certain conditions, the user is advised to consult the references provided for determining if the application of the
methods is appropriate.
6. Terms of Use
ETCalc can be used freely.
The authors do not assume any responsibility for the tool's operation, output, interpretation, or use
of results. Please contact the author for additional information and feedback.
7. References
Abtew W (1996) Evapotranspiration measurements and modeling for three wetland systems in south Florida. J. Am.
Water Resour. Assoc. 32: 465-473.
Allen RG, Pereira LS, Raes D, Smith M (1998) Crop Evapotranspiration: Guidelines for Computing Crop Water
Requirements. FAO Irrigation and Drainage Paper 56, Rome, 300.
Amatya DM, Harrison CA (2016) Grass and Forest Potential Evapotranspiration Comparison Using Five Methods
in the Atlantic Coastal Plain. J. Hydrol. Eng. 05016007.
Blaney HF, Criddle WD (1950) Determining water requirements in irrigated areas from climatological and
irrigation data. United States Department of Agriculture, Soil Conservation Service.
Brouwer C, Heibloem M (1986) Irrigation Water Management: Irrigation Water Needs. Part II - Determination
of Irrigation Water Needs. FAO Irrigation Water Management. Training manual No. 3, FAO, Land and Water
Development Division, Rome, Italy.
Cai J, Liu Y, Lei T, Pereira LS (2007) Estimating reference evapotranspiration with the FAO Penman-Monteith
equation using daily weather forecast messages. Ag. For. Meteor. 145: 22-35.
Carmona F, Rivas R, Kruse E (2017) Estimating daily net radiation in the FAO Penman-Monteith method. Theor.
Appl. Climatol. (2017) 129:89-95.
Hargreaves GH, Allen RG (2003) History and evaluation of Hargreaves evapotranspiration
equation. J Irring Drain Engine. 129: 53-63.
Jensen ME, Burman RD, Allen RG (1990) Evapotranspiration and Irrigation Water Requirement. ASCE Manuals and
Reports on Engineering Practices. Vol. 70. New York, NY: American Society of Civil Engineers. ISBN 978-0-87262-763-5.
Jensen ME, Haise H (1963) Estimating evapotranspiration from solar radiation. Journal of the Irrigation
and Drainage Division. Proceedings of the ASCE 1963; 89: 15-41.
McGuinness JL, Bordne EF (1972) A comparison of lysimeter-derived potential evapotranspiration with computed values.
Technical Bulletin 1452. Agricultural Research Service, US Department of Agriculture, Washington, DC.
McKenney MS, Rosenberg NJ (1993) Sensitivity of some potential evapotranspiration estimation methods to
climate change. Agric. For. Meteorol. 64, 81-110.
McVicar TR, Roderick ML, Donohue RJ, Li LT, Van Niel TG, Thomas A, Grieser J, Jhajharia D, Himri Y, Mahowald
NM, Mescherskaya AV, Kruger AC, Rehman S, Dinpashoh Y (2012) Global review and synthesis of trends in
observed terrestrial near-surface wind speeds: Implications for evaporation. Journal of Hydrology. 416-417:
182-205
Pereira AR, Pruitt WO (2004) Adaptation of the Thornthwaite scheme for estimating daily reference evapotranspiration.
Ag. Wat. Manag. 66: 251-257.
Priestley CHB, Taylor RJ (1972) On the assessment of the surface heat flux and evaporation using large-scale
parameters. Mon. Weather Rev 100: 81-92.
Tegos A, Efstratiadis A, Koutsoyiannis D. (2013) A Parametric Model for Potential Evapotranspiration Estimation
Based on a Simplified Formulation of the Penman-Monteith Equation.In Evapotranspiration - an overview,
Alexandris S (ed.), IntechOpen, eBook ISBN: 978-953-51-5369-6.
Thornthwaite CW (1948) An approach toward a rational classification of climate. Geogr. Rev. 38: 55-94.
Turc L (1961) Estimation of irrigation water requirements, potential evapotranspiration: A simple climatic formula
evolved up to date. J. Ann. Agron., 12: 13-14 (in French).
Willmott CJ, Rowe C., Mintz Y (1985) Climatology of the terrestrial seasonal water cycle. J. Climatol. 5: 589-606.
Zotarelli L, Dukes MD, Romero CC, Migliaccio KW, Morgan KT (2010) Step by Step Calculation of the Penman-Monteith
Evapotranspiration (FAO-56 Method). AE459. Agricultural and Biological Engineering Department, Florida Cooperative
Extension Service, IFAS, UF. URL: http://edis.ifas.ufl.edu/ae459, 12 pgs.
8. Contact
Serban Danielescu, Ph.D.
Research Scientist | Chercheur scientifique
Environment and Climate Change Canada | Environnement et Changements Climatiques Canada
Fredericton Research and Development Centre | Centre de recherche et développement de Fredericton
95 Innovation Rd., Fredericton, NB, E3B 4Z7
Telephone/Téléphone: 506-460-4468
Facsimile/Télécopieur: 506-460-4377